
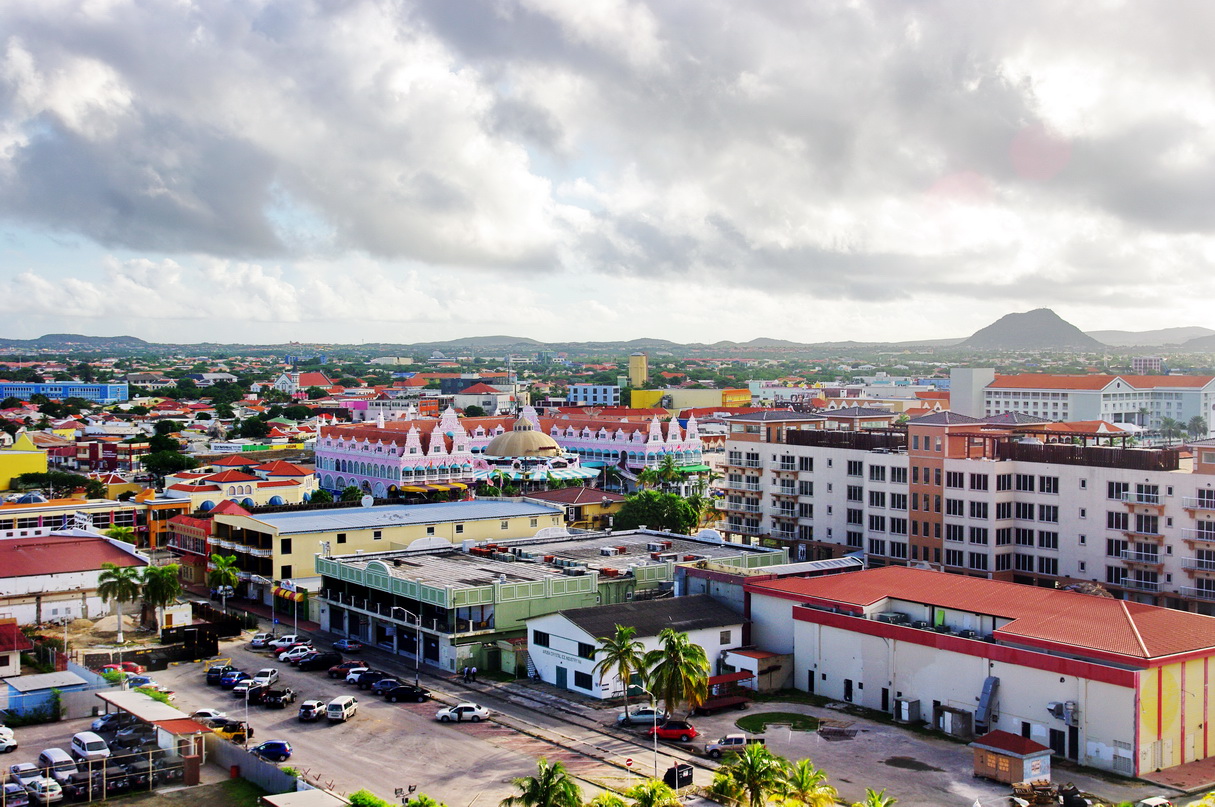
Oranjestad
Aruba · Latin America · 28,658 people · America/Aruba · AWG
Oranjestad scores 71.4/100 for digital nomads under balanced weights, ranking 65 of 1000 cities. There is no open cost-of-living figure yet; expect no dedicated nomad visa, and a measured median download speed of 45.5 Mbps.
Oranjestad is the capital of Aruba, a small Dutch Caribbean island south of the hurricane belt with a dry, sunny climate, steady trade winds and a remote-work scheme allowing stays of up to 90 days. English is spoken everywhere, but the island is expensive, built around resort tourism along Palm Beach and needs a car beyond the hotel strip.
- One Happy Workation 90-day stay
- Eagle Beach and Palm Beach
- Constant trade winds
- High prices
Eating out
OpenStreetMap, 2026-1016126restaurants within 3 km
Mapped around the centre of Oranjestad: a modest scene, worth checking the neighbourhoods. A count of what is on the map, not a rating, and it does not affect the score.
How Oranjestad scores, factor by factor
Superscripts link to the source list at the bottom. Country-level figures apply to all of Aruba.
Cost of living
Monthly cost for one person (log-scaled, cheaper is better).Safety
Homicide rate and political stability (country-level).Healthcare
WHO universal-health-coverage index and life expectancy (country-level).Internet
Median measured download and upload speed (M-Lab, city-level; the province or country aggregate where the city has too few tests).Visa ease
How easily your passport gets in and stays: visa-free days, eTA, visa on arrival, e-visa or consular visa, plus a nomad visa and how affordable its income threshold is. Averages US, EU and UK passports until you pick yours.Getting there & around
Non-stop airport destinations (hub size) plus editorial walkability and transit ratings.Climate
Share of months that are comfortable: 59–82°F (15–28 °C) mean, at most 5.9 in (150 mm) rain, at most 85% humidity.- Comfortable months: 8 of 1214 · city-level, 2001–2020 normals
Air quality
Annual mean PM2.5 on a fixed scale: 5 µg/m³ (WHO guideline) scores 100, 50 µg/m³ or worse scores 0.- Annual mean PM2.5: 10.7 µg/m³15 · city-level, 2023
Quality of life
Human Development Index and English proficiency (country-level).What does Oranjestad cost per month?
| Total, one person | no data | country estimate |
|---|---|---|
| One-bedroom rent, centre | no data | city-level rent unavailable |
| Country cost index (US = 100) | no data | country |
Can you stay legally?
| Nomad visa | none listed | |
|---|---|---|
| Minimum income | — | |
| US passport | 90 days | |
| EU passport | unlimited | |
| UK passport | 90 days | |
Visa rules change often. Verify with the issuing government before you book.
Airports and nonstop flights
Oranjestad is served by one airport.
| Airport | Nonstop destinations | International | From US airports |
|---|---|---|---|
| AUAQueen Beatrix International Airport | 35 | 35 | 16 |
Wikipedia airport pages as of 2026-10: seasonal routes included, charters and announced-but-not-started routes excluded.
What is the weather like through the year?
Comfortable months by our rule: Dec–Jul. Rank cities for Dec–Feb →
| Month | Jan | Feb | Mar | Apr | May | Jun | Jul | Aug | Sep | Oct | Nov | Dec |
|---|---|---|---|---|---|---|---|---|---|---|---|---|
| Mean °F | 80 | 79 | 80 | 80 | 82 | 82 | 82 | 83 | 84 | 83 | 83 | 81 |
| Rain in | 1.1 | 0.6 | 0.4 | 0.4 | 0.8 | 0.8 | 1 | 1.1 | 2 | 3.7 | 3.5 | 2.4 |
| Humidity % | 79 | 78 | 79 | 81 | 83 | 83 | 83 | 81 | 81 | 81 | 80 | 79 |
Green temperatures mark months that meet the comfort rule (59–82°F, ≤5.9 in rain, ≤85% humidity). NASA POWER 2001–2020 climatology at the city coordinates.
Where can you stay in Oranjestad?
Three ways to live here, and what each does to the monthly budget. Rents are the one-bedroom figures from the cost table; hotels and short lets are priced per night and cost more, most of all in high season.
| Option | Rent per month | Monthly total | Notes |
|---|---|---|---|
| One-bedroom outside the centre | — | — | No city-level cost here; the total is a national estimate. |
| One-bedroom in the centre | — | — | No city-level rent figure for this city. |
| Hotel or short let | — | — | For the first weeks or a stay under a month. Compare hotels on Navoy → |
Monthly rents assume an unfurnished lease of six months or more; furnished monthly lets usually cost 20 to 50 percent more.
Cities with a similar profile
- Willemstad Curaçao · 68.1
- Punta del Este Uruguay · 65.2
- Rosario Argentina · 66.4
- Colonia del Sacramento Uruguay · 70.1
- Bridgetown Barbados · 75.6
Also in Latin America: Aguascalientes, Antigua Guatemala, Antofagasta, Arequipa, Armenia (Colombia), Asunción
Where Oranjestad ranks
Frequently asked
- How much does it cost to live in Oranjestad as a digital nomad?
- We do not have a reliable monthly cost figure for Oranjestad yet.
- Is Oranjestad safe for digital nomads?
- Oranjestad scores 92/100 on safety. Aruba records — homicides per 100,000 people per year (WHO, 2021) and a political-stability score of 87.8/100 (World Bank WGI). Both figures are national, so neighbourhood-level risk can differ.
- Does Aruba have a digital nomad visa?
- No dedicated digital nomad visa was listed for Aruba as of 2026-10-13. Visitors from the US can stay 90 days visa-free. The long-stay routes that do exist are in the Aruba visa guide: https://nostos.navoy.io/visas/aruba
- How fast is the internet in Oranjestad?
- Measured median download speed in Oranjestad was 45.5 Mbps (upload 9.4 Mbps) across 4,556 M-Lab tests in 2024. Measured speeds run below advertised plan speeds everywhere, so compare cities rather than reading the number as a plan.
- Is Starlink available in Oranjestad?
- Not yet. Starlink's availability map lists Aruba as coming soon (Starting in 2026) as of 2026-10. Roaming plans may work for short stays, but local rules on using them vary.
- Which airports serve Oranjestad and how many nonstop flights are there?
- Oranjestad is served by Queen Beatrix International Airport (AUA) with 35 nonstop destinations, of which 35 are international. 16 US airports have a nonstop link. Source: Wikipedia, 2026-10.
- When is the best time of year to be in Oranjestad?
- The most comfortable months are Jan, Feb, Mar, Apr, May, Jun, Jul, Dec. Mean temperatures range from 79°F (26°C) in Feb to 84°F (29°C) in Sep (NASA POWER 2001–2020 climatology).
- Oranjestad or Willemstad: which is better for digital nomads?
- Willemstad is the city with the closest factor profile to Oranjestad in this dataset. Which one wins depends on your weights; the comparison page puts every factor side by side with the numbers behind them.
Sources
Dataset 2026.10.7, published 2026-10-13. Download the full dataset or read the methodology.
- 1.City population (latest census or official estimate), Wikipedia (citing national statistics offices). CC BY-SA 4.0. Retrieved 2026-09-22. City-proper figures; the per-city source URL is stored with the seed row.
- 2.2026 Cost of Living Index (country level), WhereNext. CC BY 4.0. Retrieved 2026-09-22. Country-level monthly estimate used only where no city-level figure exists; cost_index kept for every city.
- 3.Cost of Living Global 2026 (city rows), WhereToEmigrate. CC BY 4.0. Retrieved 2026-09-22. monthly_cost_single_eur and rent_1br_center_eur, converted to USD at the ECB reference rate on the retrieval date (see ecb-frankfurter).
- 4.Estimates of rates of homicides per 100 000 population, World Health Organization, Global Health Observatory. CC BY-NC-SA 3.0 IGO (WHO data policy). Retrieved 2026-09-22. WHO GHO modelled estimate, used only where UNODC has no national figure from 2018 or later (seven countries in this dataset). May be reused with attribution under WHO's data policy.
- 5.Worldwide Governance Indicators — Political Stability and Absence of Violence (score 0–100), World Bank. CC BY 4.0. Retrieved 2026-09-22.
- 6.UHC service coverage index, World Health Organization, Global Health Observatory. CC BY-NC-SA 3.0 IGO (WHO data policy). Retrieved 2026-09-22.
- 7.Life expectancy at birth (years), both sexes, World Health Organization, Global Health Observatory. CC BY-NC-SA 3.0 IGO (WHO data policy). Retrieved 2026-09-22.
- 8.M-Lab NDT statistics (city aggregates, 2024), Measurement Lab. CC0 1.0. Retrieved 2026-09-22. Median of daily median download/upload throughput over 2024 for the city aggregate; sample count is the number of tests. Speeds reflect user-initiated tests, not advertised plans.
- 9.Starlink availability map, SpaceX (Starlink). Factual status cited from starlink.com. Retrieved 2026-10-07. Residential service status per country from the file Starlink's map loads. Grouped as on the map: launched or available = available; coming soon, pending regulatory approval or test = coming soon; blacklisted = not offered; unknown or excluded = unknown. Shown on city pages and as a ranker filter; not part of any score. Roaming and maritime plans can work in more places.
- 10.Nostos long-stay visa guides, Navoy. CC BY 4.0. Retrieved 2026-10-04. One record per country in data/manual/visas/<iso2>.json, compiled into data/visa-guides.json. Each guide lists the official government pages it was compiled from with retrieval dates. A guide's `verification` field is set only when a named person has re-read every source; until then pages say the guide is not yet reviewed by a person.
- 11.Passport Index dataset (visa requirements, 199 passports × 199 destinations), Ilya Ilyankou (compiled from passportindex.org). MIT. Retrieved 2026-09-22. Days per visit where stated; 'visa free' without a limit is credited as unlimited; eTA, visa on arrival, e-visa and visa required are credited 0 days for scoring but shown by kind. The default US/EU/UK figures use the US, German and British passports.
- 12.Airport destinations (Wikipedia airline and destination tables), Wikipedia contributors; countries via Wikidata. CC BY-SA 4.0. Retrieved 2026-09-24. Distinct destination airports listed in each airport article's passenger table, resolved through Wikidata. Seasonal routes count; charters and routes announced but not yet flying are excluded. The as-of date is the newest article revision among the city's airports. Falls back to the OpenFlights snapshot when an airport has no article or table.
- 13.Walkability and transit ratings (editorial), Navoy. CC BY 4.0. Retrieved 2026-09-22. Judgment ratings, not measurements. Explained on /methodology.
- 14.NASA POWER climatology (2001–2020 monthly means), NASA Langley Research Center. Public domain (US Government). Retrieved 2026-09-22. T2M, PRECTOTCORR and RH2M at the city coordinates (0.5° grid). Monthly precipitation = mm/day × days in month.
- 15.SatPM2.5 satellite-derived annual PM2.5 (V6.GL.02.04), Atmospheric Composition Analysis Group, Washington University in St. Louis. CC BY 4.0. Retrieved 2026-10-07. Annual 2023 PM2.5 for the 0.1° grid cell at the city centre, from satellite aerosol retrievals combined with a chemical transport model and ground monitors. Used only for cities with no WHO database row. Where the same country has WHO-measured cities, values are scaled by the median measured/satellite ratio there (corrects desert-dust overestimates in the Gulf). Across 247 cities with both, log-correlation with WHO values is 0.88 and the median difference 2 µg/m³.
- 16.OpenStreetMap restaurants (Overpass API), OpenStreetMap contributors. ODbL 1.0. Retrieved 2026-10-02. Count of OpenStreetMap elements tagged amenity=restaurant within 3 km of the city centre coordinate. Measures how many restaurants are mapped, which tracks real density well where OpenStreetMap is well maintained (Europe, the Americas, East and Southeast Asia) and under-counts where it is not (parts of Africa and Central Asia).
- 17.Human Development Index (HDR 2025, HDI 2023), United Nations Development Programme. CC BY 3.0 IGO. Retrieved 2026-09-22.
- 18.EF English Proficiency Index 2024 (band), EF Education First. Proprietary; band cited as a fact with attribution. Retrieved 2026-09-22. Only the proficiency band is stored, transcribed by hand from the public ranking.